Project statistics for
your AI coding projects
Open one panel and read the full project statistics for any project: time open, active time, idle time, prompts sent, agents opened, tokens burned and dollar cost. The project dashboard your project management was missing.
Project statistics in AgentsRoom turn a week of agent work into numbers you can act on. No spreadsheet, no manual time tracking, no guessing where the hours went.
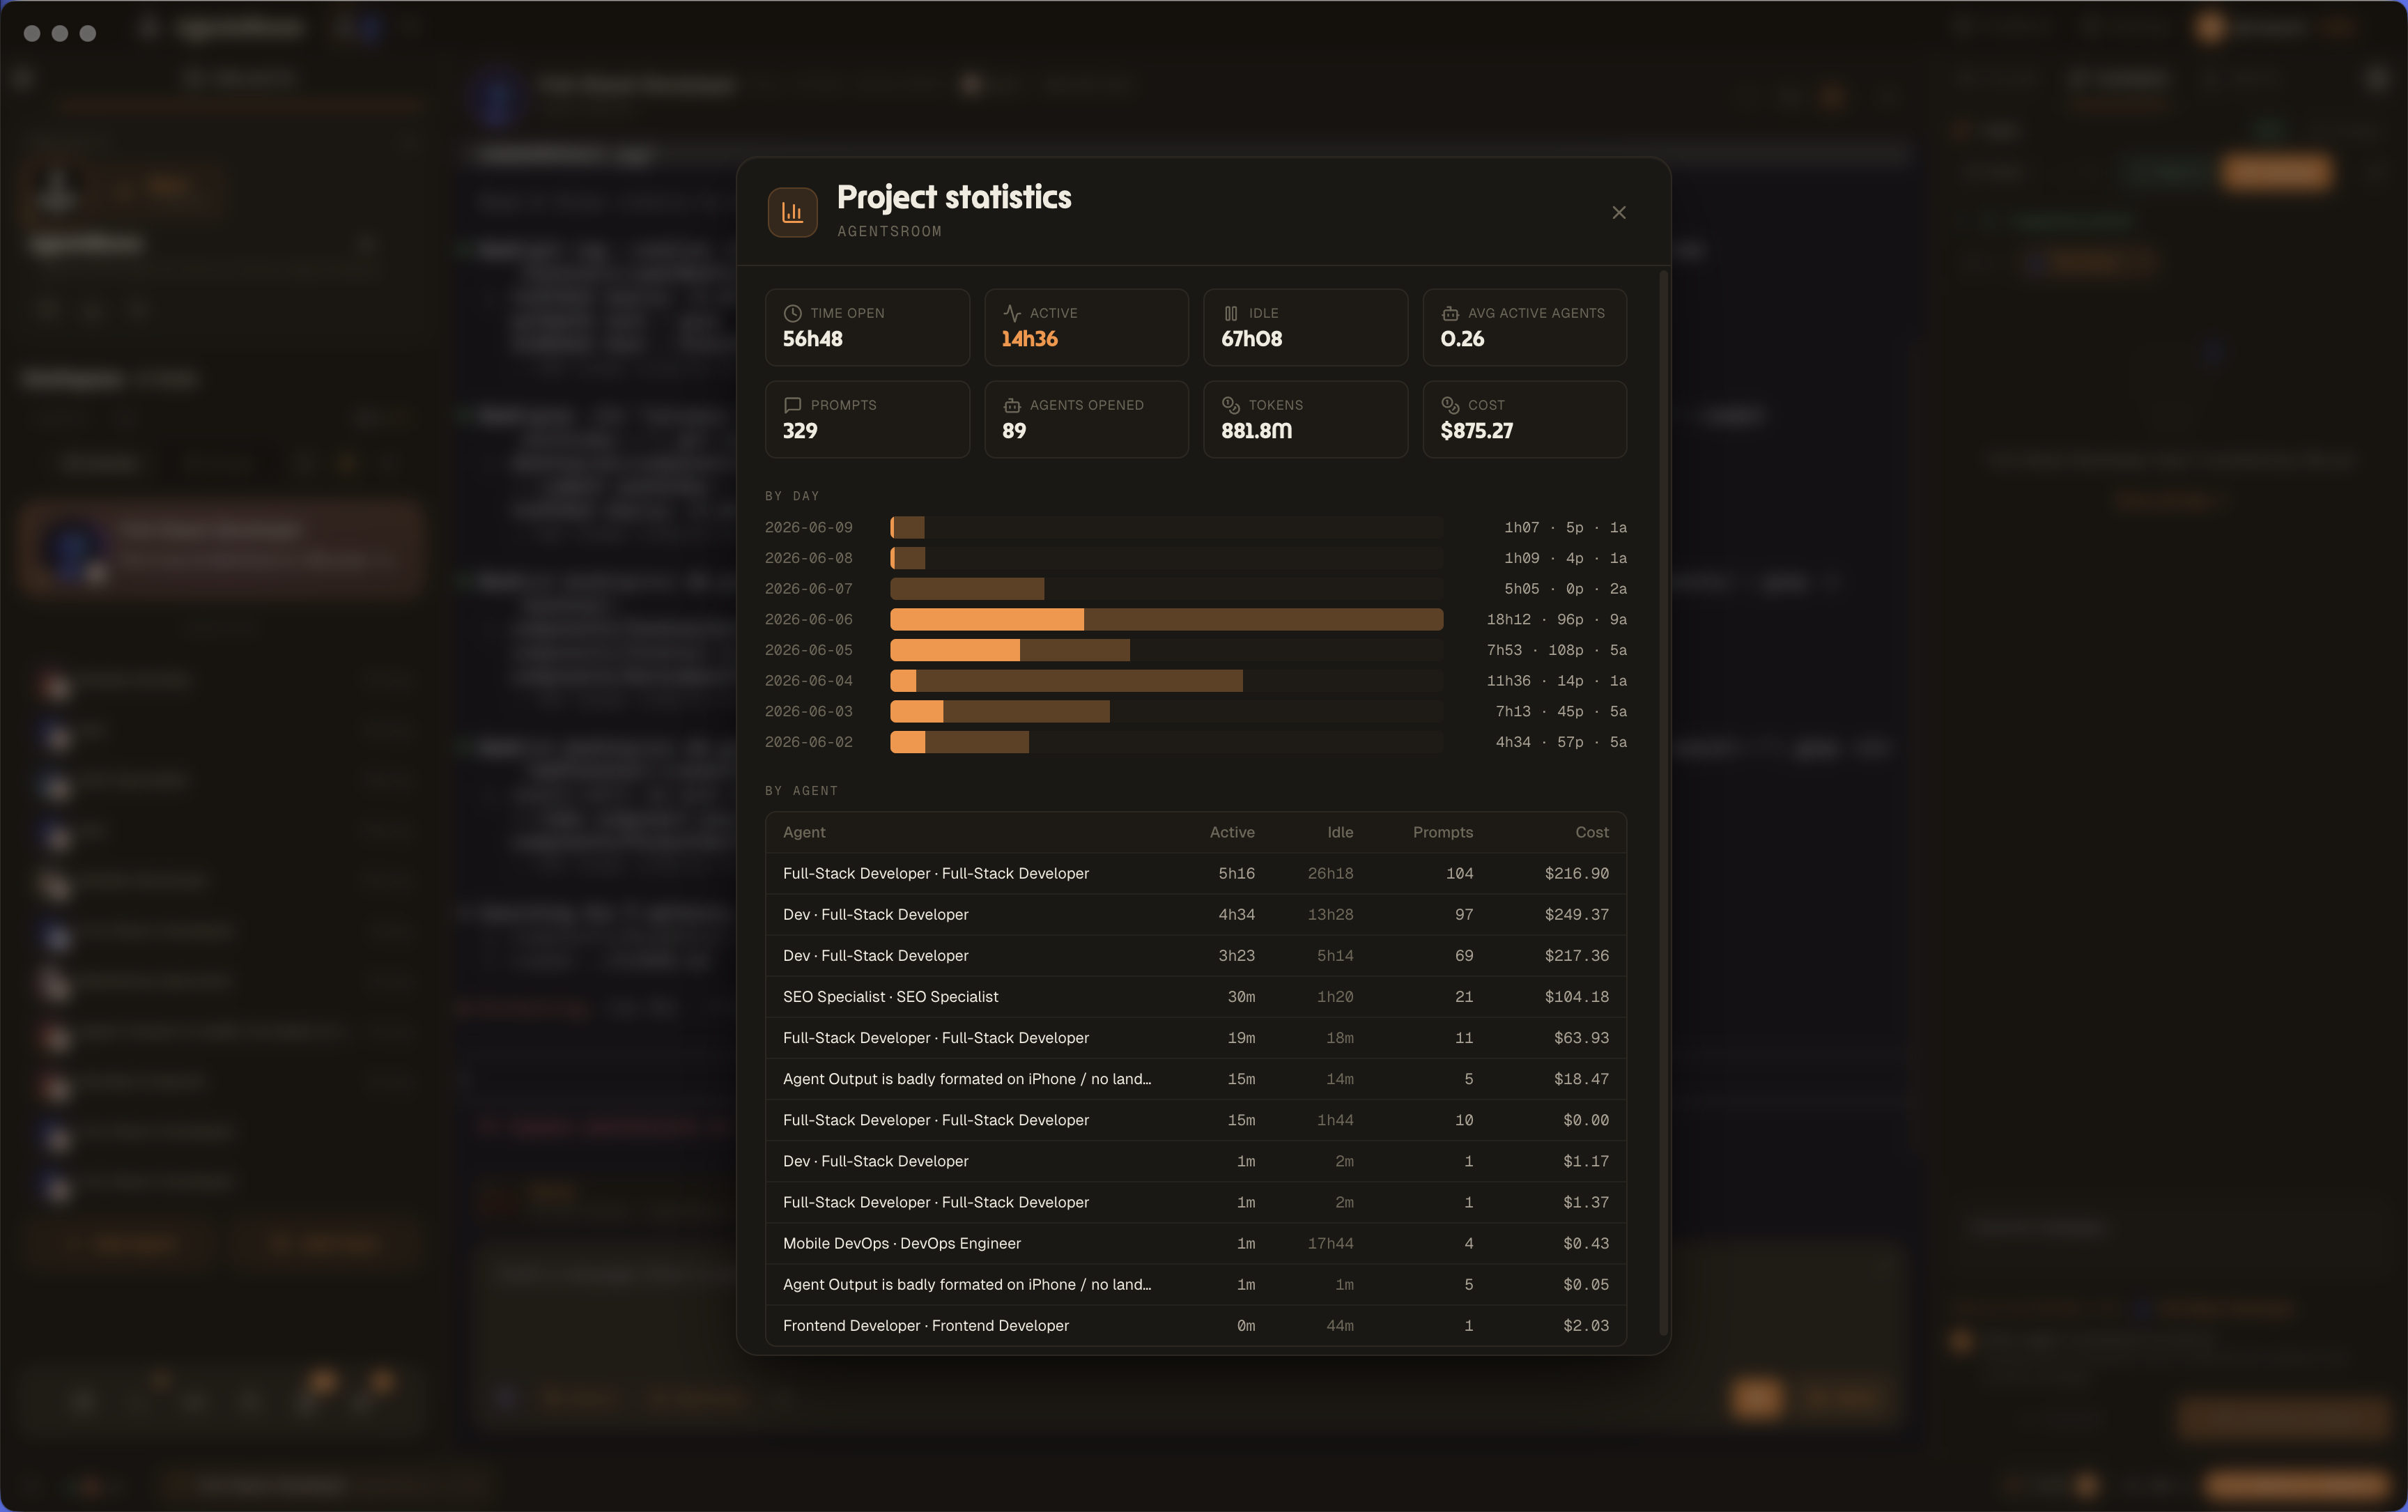
The project statistics panel: headline metrics on top, a per-day activity chart, and a per-agent breakdown of time, prompts and cost.
Project statistics answer the question every developer and project manager keeps asking: where did the time actually go? AgentsRoom tracks it while your agents work, then lays the whole project out in one view.
You get project statistics per project and per agent. Total time open, active versus idle, prompt count, agents opened, token consumption and cost. The same project analytics a lead wants for a sprint review, and the same project metrics a freelancer needs to bill a client.
No timer to start. No tags to maintain. The project statistics are computed from what your agents already did, so the time tracking stays honest and automatic.
Why project statistics matter for project management
Multi-agent coding hides the cost. Five agents run across three days, one of them quietly burns 880 million tokens, and by Friday nobody can say which project ate the budget. Project statistics put that number back on screen.
With project statistics you compare projects, spot the day a project went sideways, and see which agent did the heavy lifting. That per-agent breakdown is the part most time tracking tools never give you.
Good project management runs on real numbers, not a gut feeling. These project metrics are the numbers.
What the project statistics panel shows
Activity metrics, a per-day chart, a per-agent table and factory efficiency. Compare cost against tickets actually shipped.
Time open
Total wall-clock time the project has been open. The denominator behind every other number in your project statistics.
Active time
How long your agents were actually working. The line in the project statistics that tells you real effort, not idle hours.
Idle time
Time the project sat open with nothing running. Handy project analytics for catching forgotten sessions.
Average active agents
How many agents ran in parallel on average. A quick read on how multi-agent a project really was.
Prompts
Total prompts sent across the project. The clearest productivity metric for how much you steered your agents.
Agents opened
How many agent sessions the project spawned. The part of the project statistics that shows the breadth of the work.
Tokens
Total tokens consumed across every agent. The project statistics line item that drives your bill.
Cost
Estimated model cost in dollars for the whole project, summed from observed agent usage. This is not your subscription invoice.
Cost per shipped ticket
Filter by project, team and UTC dates, compare the previous period, and inspect the included tickets and runs. Shipped means Done, excluding declined tickets. All recorded costs linked to those tickets count, including work outside the period. Missing prices and historical gaps are shown as partial data.
Per day and per agent, not just one big total
A single total hides the story. The project statistics break down two ways so you can see the shape of the work.
By day
One bar per day: active time, prompts and agents for that date. Scan it and the busy days, and the quiet ones, jump out. This is the project analytics view that tells you when a project really moved.
By agent
One table row per agent: active time, idle time, prompts and cost. The per-agent breakdown shows you which agent, and which role, carried the project and what each one cost.
How project statistics work
Automatic activity tracking with an account-synced cost history. Ticket cost attribution starts when this version is installed.
Your agents work
Run Claude Code, Codex, Antigravity CLI or any provider across your projects. AgentsRoom records time, prompts, tokens and cost in the background. There is no timer to start.
Open the project statistics
Click the project stats icon on any project. Read its activity totals, then select a project, team and date range in Factory efficiency to compare cost per shipped ticket and inspect its calculation.
Act on the numbers
Bill the client, trim the agent that overspent, or flag the day a project stalled. Project statistics you can actually use for project management.
Where project statistics earn their keep
Three moments where the project analytics pay off.
Billing a client
Time spent per project and cost per agent, ready to drop into an invoice. Project statistics replace the timesheet you kept forgetting to fill.
Sprint retrospective
Pull up the per-day chart and the per-agent breakdown for the week. The project metrics make a retro concrete instead of anecdotal.
Controlling agent cost
Spot the agent that burned the tokens and the day the cost spiked. These project statistics turn a surprise bill into something you saw coming.
Project statistics are one half of the picture. They live next to the way AgentsRoom lets you monitor AI agents across every project, live.
Monitor AI agentsProject statistics are a running total: what a project has consumed since day one. For the other question, how much of the window that is open right now a project or an agent just took, the usage popover splits the percentage your provider publishes.
See your plan share, per project and per agentFAQ
What are project statistics in AgentsRoom?
Project statistics are a per-project breakdown of time spent, prompts sent, agents opened, tokens consumed and cost. Open the panel on any project and you get eight headline metrics, a per-day activity chart and a per-agent table, all computed from your real agent work.
Do I have to start a timer for the time tracking?
No. The time tracking is automatic. Project statistics are derived from what your agents actually did, so active time, idle time and per-agent time are recorded without you touching a stopwatch.
Can I see project statistics per agent?
Yes. The per-agent breakdown is a table with active time, idle time, prompts and cost for every agent in the project. It is the part of the project analytics that shows which agent, and which role, carried the work.
Does the cost in the project statistics cover every agent?
Yes. The cost line sums the dollar cost of every agent in the project, across providers. It is the project metric your project management reports on, and it sits right next to the token total it comes from.
Are project statistics useful for project management?
That is the whole point. Project statistics hand a project manager real numbers for retros, billing and budgeting: time per project, prompts, per-agent cost and a per-day view of when the work happened.
Where does the data behind the project statistics come from?
Locally, from your own agent sessions. AgentsRoom reads the activity already on your machine and turns it into project statistics. Nothing extra to log, no external tracker, no spreadsheet to keep.
See your project statistics tonight
Download AgentsRoom, run your agents, and open the project statistics panel on your first project.
Companion app: monitor your agents on the go
Bring your own: Claude, Codex, Antigravity CLI, or other AI provider.
Push bugs and requests straight to your public backlog.