Claude Code token usage,
tracked per session, in real time
AgentsRoom watches your Claude Code token usage in every agent terminal. A small token counter sits in the composer and updates live. When your token consumption gets heavy on a single Claude session, the badge turns red and warns you before you blow through the context window.
Click the badge and the session monitor opens : input tokens, output tokens, cache reads, cache writes, cache hit rate, message count, models routed, session duration and tool uses. One panel, one Claude session, all the numbers that drive your Claude Code token usage.
Free · macOS · 100% local, no proxy
Live demo of the Claude Code token usage badge in AgentsRoom : it sits in every agent composer, turns red on heavy token consumption, and opens a full session monitor with input tokens, output tokens, cache reads and cache writes.
Claude Code token usage is the number one variable cost of running AI coding agents. Every prompt, every tool call, every CLAUDE.md re-injection eats tokens. Without visibility, you find out you blew through your budget when the API throttles or the bill arrives. AgentsRoom puts a live Claude Code token usage meter on every agent session so you see consumption as it happens, not after.
The token counter lives in the terminal composer, right next to the send button. It updates a few seconds after each Claude turn. Tokens add up across the whole session : input tokens, output tokens, cache writes and cache reads, all summed and color-coded so you can read them in a glance. When the per-session Claude Code token usage crosses a heavy-consumption threshold, the badge flips red with a warning icon, the same way a fuel gauge nags you before the tank runs dry.
Click it and the session monitor opens. You get a live snapshot of the active Claude session : duration since the first message, number of user prompts versus assistant turns, tool uses, models that handled the conversation, the Claude session id (copyable for --resume), and the full token breakdown. Cache hit rate is computed on the fly, color-coded green / amber / red, with a one-line reminder that cache reads cost roughly ten times less than fresh input. That single panel turns Claude Code token usage from a black box into a real-time gauge.
The token badge lives next to the send button and turns red when a session's consumption gets heavy.
Why per-session Claude Code token usage matters
Most Claude wrappers report token usage at the account level, once a day, in a dashboard you have to remember to open. By then the damage is done. AgentsRoom pushes Claude Code token usage to the surface, on every single agent terminal, so you cannot ignore it. The token counter is two centimeters from the send button. You glance at it like you glance at the unread badge on your phone.
Per-session is the right granularity. A team of agents running in parallel does not tell you who is burning tokens. One agent might be looping on a stuck prompt while four others are quiet. With a per-session Claude Code token usage meter, the noisy agent stands out instantly : its badge is red, its cache hit rate is low, its message count is climbing fast. You jump in, fix the prompt, save the budget.
The whole feature is local. AgentsRoom reads your Claude Code token usage straight from the JSONL transcripts Claude writes to ~/.claude/projects/. Nothing leaves your machine. No third-party usage tracker. No proxy in front of the API. The token counter in AgentsRoom is just a faster, more visible reading of the data Anthropic already saves on your disk.
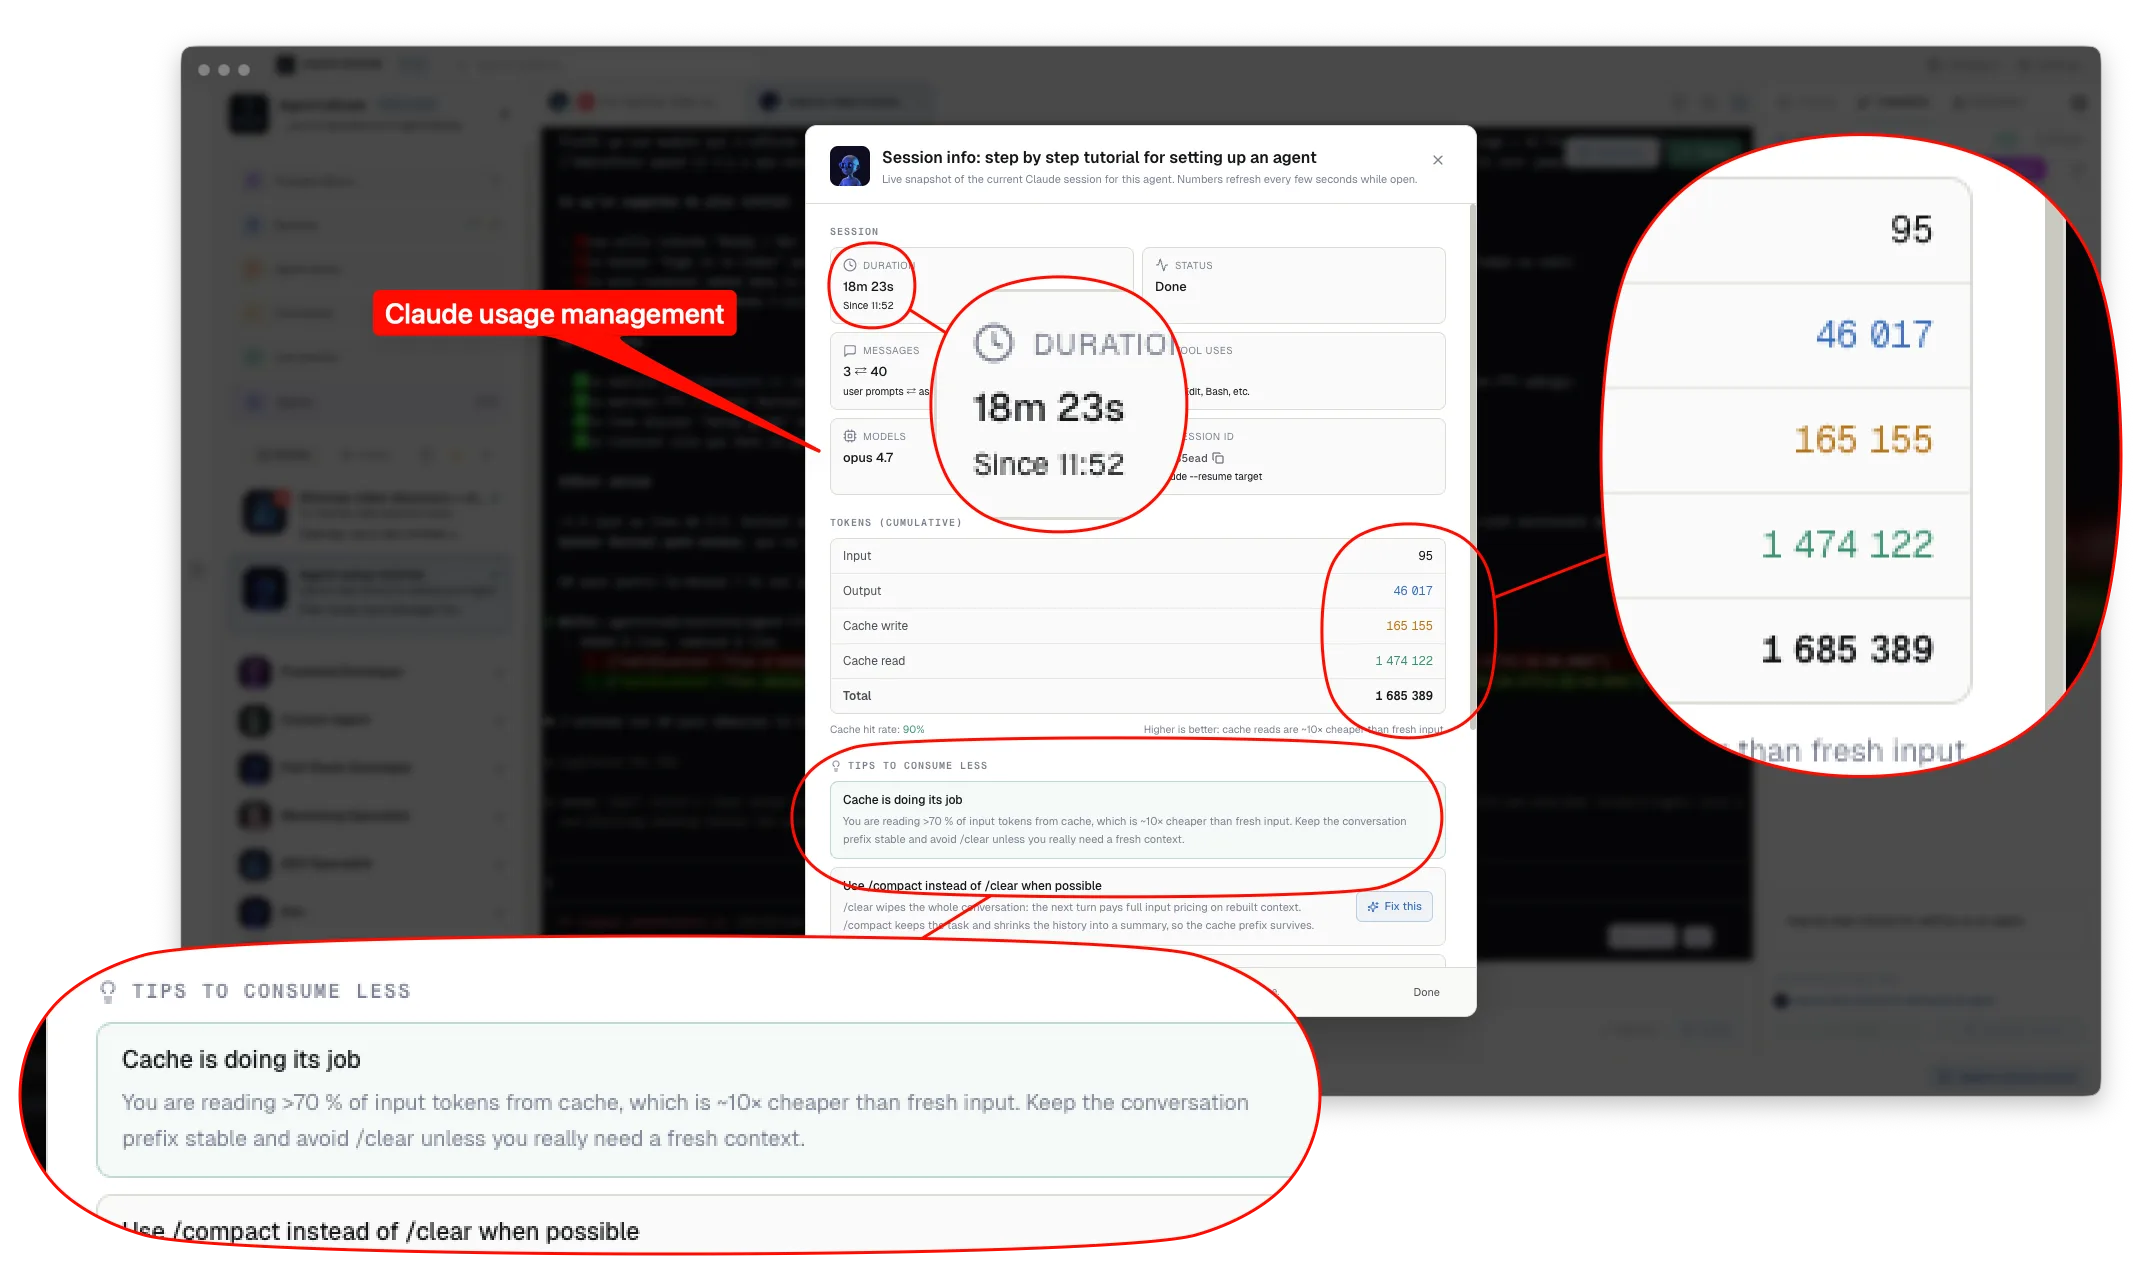
The Claude Code token usage panel in AgentsRoom. Click the per-session token badge in any agent composer, get every number that matters, plus tips to lower your token consumption.
What the Claude Code token usage panel shows
One click on the token badge opens a live session monitor. Here is every number you get on the active Claude session.
Session duration
Time elapsed between the first and the last message of the active Claude session, refreshed live. Useful to spot agents that have been chewing context for hours.
Live agent status
Idle, working, done, or needs input. The status pairs with the token counter so you see at a glance which Claude session is consuming and which is just sitting there.
Messages and assistant turns
Count of user prompts versus assistant turns in the active Claude session. A lopsided ratio is a strong signal that an agent is looping or that your prompt is too vague.
Tool uses
Total number of Read, Edit, Bash, Grep, Glob and other tool calls executed by Claude in the session. Tool calls drive a big share of input tokens, so this number tracks Claude Code token usage closely.
Models used
Every Claude model that handled a turn in the session : Sonnet, Opus, Haiku, dated variants. AgentsRoom de-dups and shortens names so you immediately see if your session was auto-routed across models.
Claude session id
The internal Claude session identifier, copyable in one click. Use it to claude --resume the exact same conversation from the CLI without losing context.
Input tokens
Fresh input tokens sent to Claude during the session, before any cache reuse. This is the most expensive bucket of your Claude Code token usage.
Output tokens
Tokens generated by Claude in the session. Output tokens are billed at a higher rate than input, so high values without progress mean an agent is spinning.
Cache writes
Tokens Claude writes to the prompt cache during the session. Cache writes are charged at a small premium but they unlock cheap cache reads on the next turns.
Cache reads
Tokens served from the prompt cache instead of being re-priced as fresh input. Cache reads cost roughly 10x less than input tokens, which is why the cache hit rate is the leading metric of your Claude Code token usage.
Cache hit rate
Percentage of input-side tokens served from cache, color-coded green above 70 percent, amber between 30 and 70, red below 30. Higher is cheaper. The single best lever on Claude Code token usage.
Total tokens
Cumulative sum across input, output, cache writes and cache reads for the active session. Useful as a single headline number when you compare token consumption across agents.
Why the token meter goes red
AgentsRoom checks your per-session Claude Code token usage on every poll. When the running total crosses a heavy-consumption threshold, the badge flips red with a warning icon. That is the cue to open the session monitor and decide what to do : compact, fork a new agent, switch model, or simply finish the task and wrap up.
Red is not a hard limit. AgentsRoom does not throttle your agent or interrupt the run. It is a visual nudge, on a single agent, so a runaway loop does not silently drain your Anthropic budget while you focus on another window. Long sessions with healthy cache hit rates are perfectly fine and stay green.
How AgentsRoom tracks Claude Code token usage
Three layers : a usage poller, a JSONL parser and a live UI.
Poller reads token totals every 15 seconds
A background task reads the per-session token usage from your local Claude state and pushes it into the renderer store. No proxy on the API, no extra network call. Just a faster, visible reading of the numbers Claude already writes to disk.
JSONL parser refreshes every 10 seconds while the modal is open
The session monitor adds a one-shot IPC call that walks the active Claude session's JSONL transcript to compute message counts, assistant turns, tool uses, models routed and first/last timestamps. Refresh runs every 10 seconds while the panel is on screen, so the numbers stay live without burning the parser on every renderer poll.
Live UI : badge plus session monitor
The badge in the terminal composer reads the token totals and decides green or red. Click it and the session monitor opens, in a portal so it overlays the whole window. Numbers are formatted with thousands separators, cache hit rate is colored, and a tips section nudges you to consume less.
Tips to lower your Claude Code token usage
The session monitor surfaces these tips contextually, based on your live cache hit rate. Send any of them straight to the agent terminal in one click.
Low cache hit rate : stabilize the prompt prefix
Below 30 percent, Claude is paying full input price every turn. Editing CLAUDE.md mid-session, switching model, or rearranging early system messages busts the cache. Lock the top of the prompt and watch the cache hit rate climb.
Use /compact instead of /clear
Slash clear wipes the conversation and forces full input pricing on the next turn. Slash compact keeps the task and shrinks the history into a summary, so the cache prefix survives. Same fresh feel, much lower Claude Code token usage.
Read partial, not whole
On files larger than 100 lines, ask the agent to use Read with offset and limit, or grep for the symbol first. Loading a 4000-line file every turn is the silent number one Claude Code token usage sink.
Edit instead of Write
The Edit tool only sends the diff back to Claude. Write retransmits the entire file. On a 600-line component, that doubles output tokens and inflates the next turn's input.
Spawn sub-agents for wide searches
Glob and Grep across hundreds of files dump a lot of noise into your main context. The Agent tool runs in its own context window and only returns a summary, keeping the parent prompt small.
Shrink your CLAUDE.md
CLAUDE.md is prepended to every turn. Each useless paragraph there costs cached input tokens times every message. Move long context into context/ and reference it on demand.
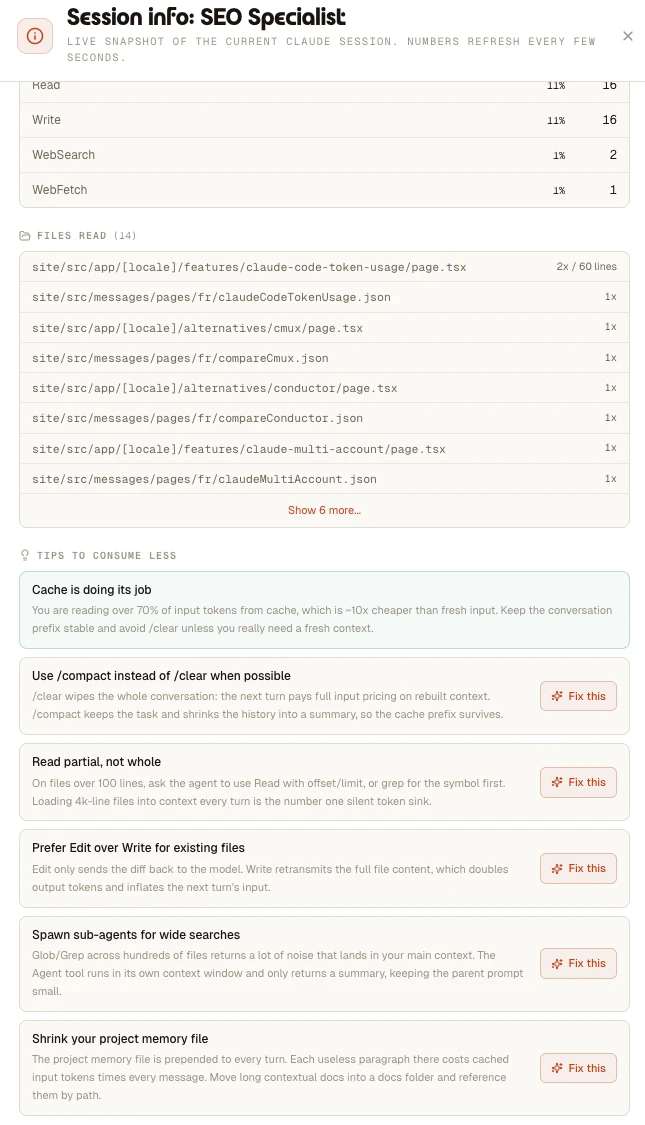
The session monitor reads your live cache hit rate and surfaces ready-to-send fixes. One click on Fix this sends the prompt straight to the agent.
AgentsRoom token meter vs vanilla Claude Code
Vanilla Claude Code shows token totals at the end of a session, in a small footer line you have to scroll up to find. There is no live meter. No per-session breakdown. No cache hit rate at a glance. No warning when consumption spikes. You discover overuse after the fact, when the API rate-limits or the monthly invoice is too high.
AgentsRoom turns Claude Code token usage into a first-class signal. Every agent gets its own token counter. Red on overuse. Click for the full breakdown. Cache hit rate computed in real time. Tips that read your live numbers and propose ready-made prompts to fix the leak. The same Claude session, same JSONL transcripts, but with the visibility a fleet of parallel agents actually needs.
When the Claude Code token usage meter saves you
Three real situations where the per-session token tracker pays for itself.
An agent is stuck in a loop
One agent keeps re-reading the same file and re-trying the same fix. Its token badge turns red within minutes, its cache hit rate plummets, its message ratio is lopsided. You spot it on the dashboard, jump in, rewrite the prompt, save the budget.
A long task is going great
Three hours into a refactor, you wonder if the agent is still on track. Open the session monitor : 700 messages, 180 tool uses, 78 percent cache hit rate, all green. Token consumption is high in absolute, normal in efficiency. Let it cook.
Overnight run on a fleet
Five agents grind through a backlog while you sleep. In the morning, the per-session token usage tells you which one was efficient, which one looped, which one ran out of context. Triage in two minutes instead of reading every transcript.
The Claude Code token usage meter is one piece of a bigger monitor surface. Live agent status, dock badges and mobile push notifications complete the picture.
See how AgentsRoom monitors AI agentsSeeing the number is step one. Our full guide breaks down exactly where Claude Code tokens go and how to cut the bill without slowing down: tighter context, the right model, delegation and more.
Read: cut your Claude Code token costsFAQ
Is the Claude Code token usage tracker accurate ?
Yes. AgentsRoom reads the same JSONL transcripts Claude itself writes to ~/.claude/projects/. Input tokens, output tokens, cache writes and cache reads are pulled directly from the per-message usage payload Anthropic emits. There is no estimation, no proxy, no rounding. The numbers in the session monitor match what Anthropic bills.
Does the token counter slow down my agent ?
No. The poller reads local files every 15 seconds. The JSONL parse only runs when the session monitor is open, every 10 seconds. There is no extra network call to Anthropic, no instrumentation injected into Claude, no overhead on tool calls. Your agent runs at full speed.
When does the badge turn red ?
When the cumulative per-session Claude Code token usage crosses a heavy-consumption threshold tuned for normal long-form coding sessions. The threshold is conservative enough that an idle session never trips it, and tight enough that a runaway loop turns red within a few turns. Red is a warning, not a throttle.
Why is the cache hit rate so important ?
Cache reads cost roughly 10x less than fresh input tokens. A session at 80 percent cache hit rate is roughly five times cheaper than the same session at 0 percent. Cache hit rate is the single best lever on your Claude Code token usage. AgentsRoom shows it live so you can correct course mid-session instead of finding out at the end.
Does it support Codex, Antigravity, OpenCode, Aider, Grok Build, Mistral Vibe and Kimi Code too ?
The session monitor in its current form is Claude-specific because it reads Claude's JSONL transcripts and the prompt-cache breakdown is a Claude-only billing feature. Status, role and notifications work for every provider. We are tracking provider-agnostic usage in the roadmap.
Does AgentsRoom send my Claude Code token usage to a server ?
No. The token counter, the session monitor and the cache hit rate are computed entirely on your Mac, from local files. Nothing leaves your machine. If you enable the optional encrypted sync to the mobile companion, only the data you explicitly choose to mirror is sent, and it is end-to-end encrypted via the AgentsRoom relay.
Can I save the tips as reusable prompts ?
Yes. Each tip in the session monitor has a Fix this button that opens an editable, ready-made prompt. Send it straight to the agent terminal, copy it to the clipboard, or save it to your global prompt library so the same fix is one click away on every project.
Stop guessing your Claude Code token usage
Download AgentsRoom and get a live per-session token meter on every Claude agent. Red on overuse, cache hit rate at a glance, tips to consume less. All local, all yours.
Companion app: monitor your agents on the go
Bring your own: Claude, Codex, Antigravity CLI, or other AI provider.
Push bugs and requests straight to your public backlog.
A glimpse of AgentsRoom in action.