Your agents drive a real browser.
Not a fake one.
AgentsRoom embeds a real Chromium browser in every project, and ships an AgentsRoom Browser MCP server that lets your AI agents control it. Your QA agent opens your localhost site, clicks the buttons, fills the forms, takes screenshots, reads the console, and verifies the feature actually works before saying done. End-to-end browser automation for Claude Code, Codex, OpenCode, Antigravity CLI, Aider, Grok Build, Mistral Vibe and Kimi Code, with zero Playwright config.
Pair it with Agent Teams: a Dev agent ships the feature, a QA agent loads the localhost site in the embedded browser, runs the verification scenario, screenshots the result, and signs off. Native browser automation is also on the roadmap, with future MCP servers planned for React Native and Electron apps so agents can test mobile and desktop apps too.
AgentsRoom Browser MCP demo: end-to-end web app testing driven by a Claude Code QA agent through the embedded Chromium browser.
Browser Automation in AgentsRoom is two things in one. First, a real Chromium browser embedded in every project room, with URL bar, back/forward, reload, history, screenshot to clipboard, open-in-default-browser, persistent cookies and localStorage per project. Second, an AgentsRoom Browser MCP server (agentsroom-browser) that exposes that browser to your AI agents through the Model Context Protocol. The agent gets a clean, scriptable interface: navigate, click, type, screenshot, evaluate JavaScript, wait for an element, get the page state, get the console logs, go back, go forward, reload.
Why does this matter? Because the entire promise of AI coding agents falls apart when the agent says 'feature shipped' but never opens the page to check. Most agents today rely on running unit tests, then they hope. With a real browser MCP, the agent loads the localhost server, exercises the user flow, sees what the human user would see, and only then signs off. The QA Engineer agent role finally has the tools it needs to do real QA, not just static analysis.
The technical setup is invisible to you. When you tick 'Browser access' on an agent, AgentsRoom merges the agentsroom-browser entry into your project's .mcp.json and the agent boots with the browser tools available. A WebSocket bridge running on a loopback port (127.0.0.1, OS-assigned, regenerated at every boot, authenticated with a 32-byte hex token) connects the MCP subprocess to the Chromium WebContentsView in the Electron app. Each click, each type, each screenshot is a JSON-RPC call. The agent sees a real browser, not a stub.
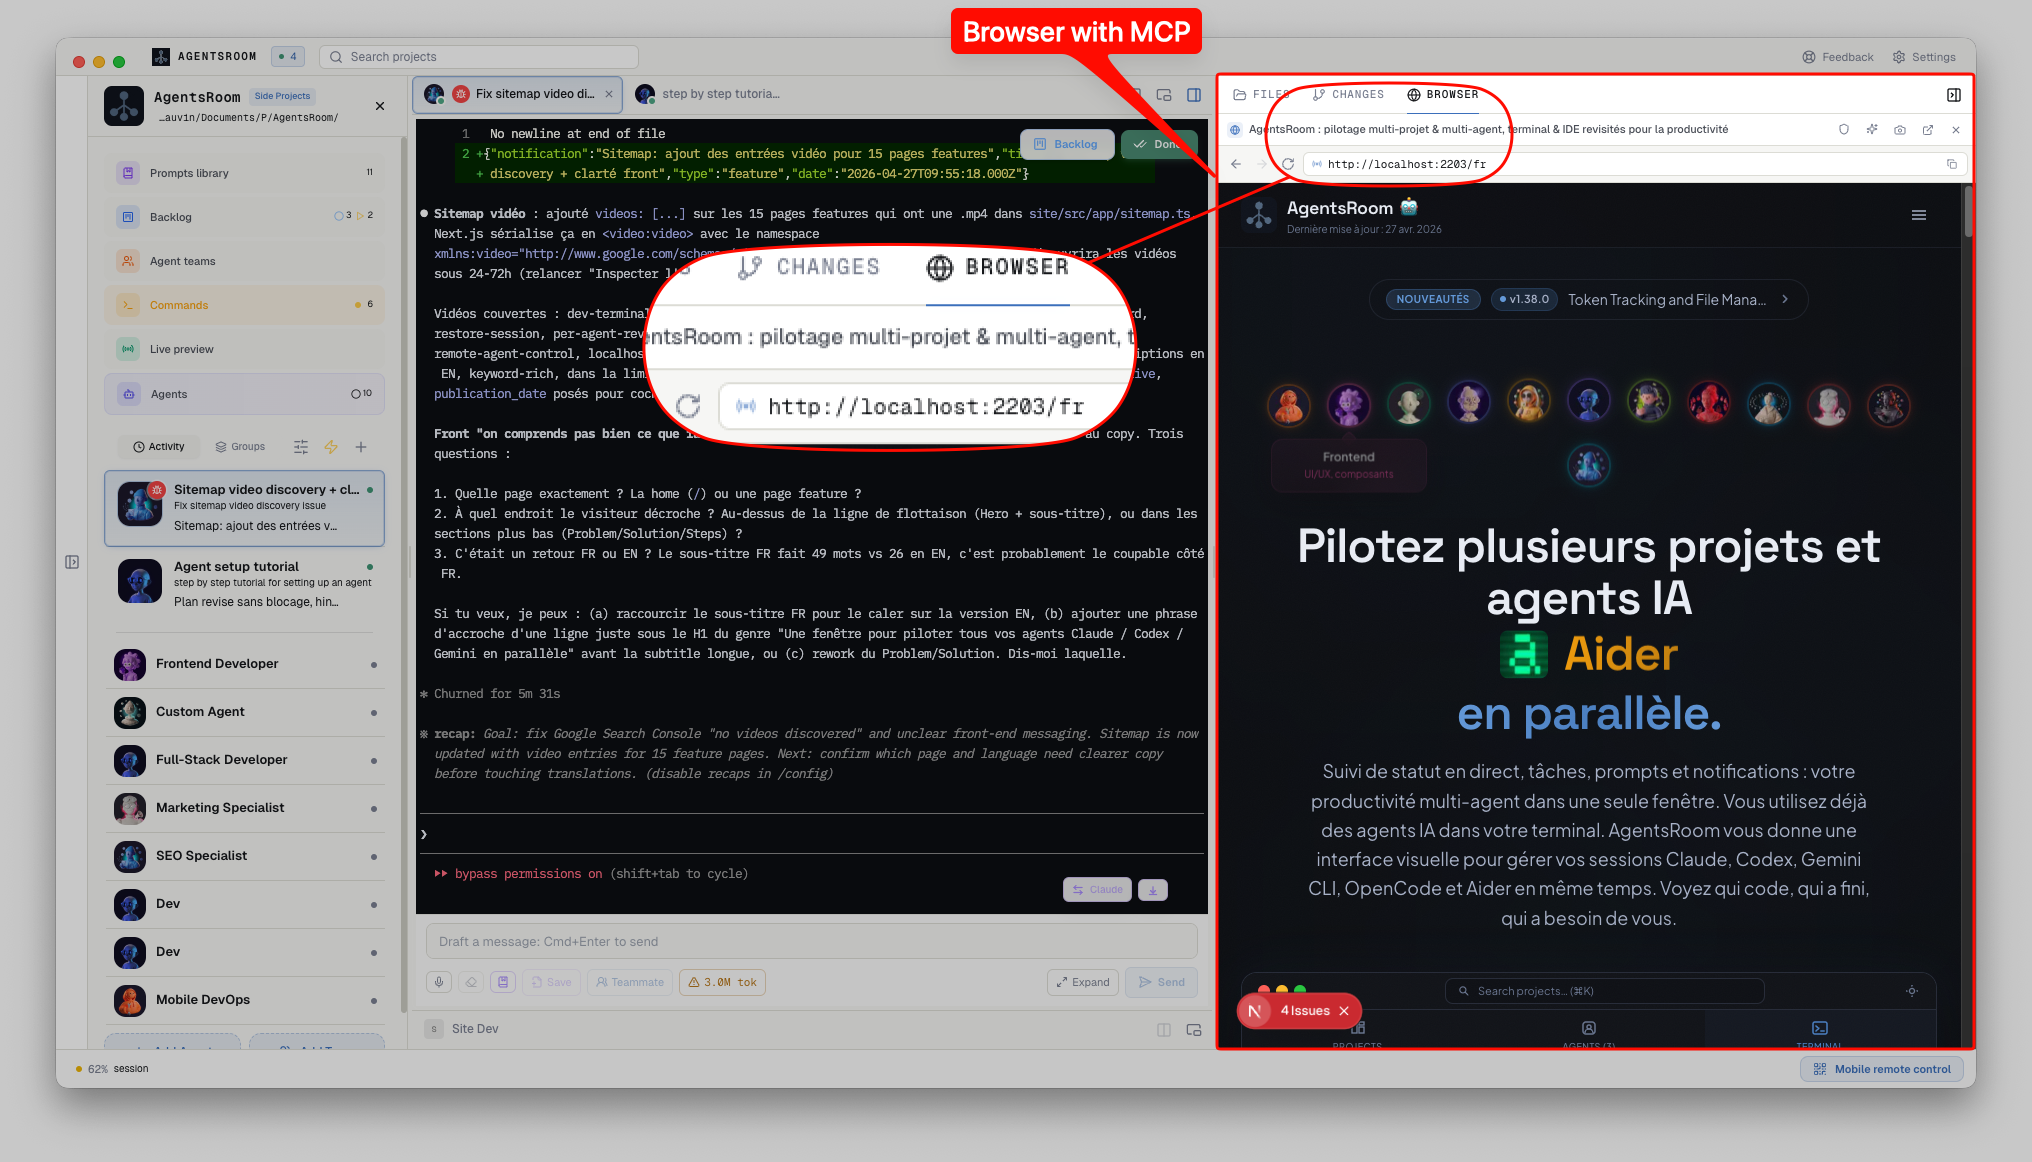
AgentsRoom Browser panel: URL bar, history, screenshot, and full MCP control surface for AI agents to navigate, click, type and verify.
A real browser, not a Playwright stub
Most AI agent demos that talk about browser automation use a headless Playwright instance spawned on each tool call. That works for benchmarks but it is painful in real life: you cannot see what the agent is doing, every navigation respawns Chromium, cookies are lost, localStorage is empty, your dev server thinks every visit is a brand new session. AgentsRoom takes a different angle. The browser is already open in your project room (you use it yourself, like a normal browser), and the agent drives that browser. Sessions, cookies, localStorage, login state, all preserved.
Each click and type from the agent triggers a real native dispatch through Electron's WebContentsView, with proper key events, mouse events and DOM mutations. Screenshots are real PNGs captured from the actual rendered page (not a DOM-to-image hack). Console logs are buffered and queryable, including warnings and errors. The agent sees the same thing you would see if you had the DevTools open: real performance, real network behavior, real CORS, real auth.
Cross-room isolation is enforced. AgentsRoom creates one Chromium WebContentsView per project, with its own session partition (persist:agentsroom-browser-<projectId>). The cookies of project A never leak into project B. When you switch project, the previous browser is hidden and the new one comes online with its own state. The agent always lands on the correct project, with the correct credentials.
The MCP layer is intentionally small and dependency-free. The browser-mcp-server.cjs subprocess speaks the MCP 2024-11-05 protocol over stdio (initialize, tools/list, tools/call) and translates it into JSON-RPC calls over the loopback WebSocket bridge. Compared to a heavy SDK-based server, this stays fast (first tool call is sub-100ms) and easy to debug. After every action that changes the page (click, type, navigate, reload, back, forward), the response includes a base64 PNG screenshot capped at 1.6 MB so the agent always sees the result of what it just did. This turned out to be the single biggest reliability win: agents that see the screen do the right thing far more often than agents that hope.
The Browser MCP toolkit your agents get
Every AI agent with browser access boots with these tools available. They are exposed through standard MCP, so any compatible CLI sees them: Claude Code, Codex CLI, OpenCode, Antigravity CLI, Aider, Grok Build, Mistral Vibe, Kimi Code.
browser_navigate
Open a URL in the embedded browser. Smart URL handling: localhost:3000 becomes http://localhost:3000 instead of triggering a 'cannot open application' dialog. Returns the final URL and a screenshot of the page after load.
browser_click
Click on an element by selector or by visible text. Real native click event, not a JavaScript dispatch. Returns the post-click screenshot so the agent sees the result of its action.
browser_type
Type text into an input or textarea. Supports keyboard shortcuts and submit. Real key events, the page's onChange handlers fire. Returns the screenshot after typing.
browser_screenshot
Capture the current viewport as a PNG. Useful for visual regression checks, design QA, before-and-after comparisons, or sharing the state of a bug with the rest of the team.
browser_evaluate
Run a JavaScript expression in the page's main world. Get back the serialized result. Used by agents to read the page state, query the DOM, inspect a Redux store, or trigger an action that has no visible button.
browser_wait_for
Wait for an element to appear, for the URL to change, for a network request to finish, or for arbitrary JavaScript to return true. Avoids the classic 'agent clicks too fast' race.
browser_get_state
Read the current URL, title, viewport, scroll position, and a structured snapshot of the page's accessible elements. The agent's primary input when it needs to plan its next action.
browser_get_logs
Pull the console buffer (log, warn, error). The agent can see the same React warnings, hydration errors, network failures and runtime exceptions you would see in DevTools. Bug reports become 'here is the error from the console'.
browser_go_back / forward / reload
Standard browser navigation, scriptable. Used by agents to backtrack when a flow goes wrong, or to re-test a page after a hot reload from Vite, Next.js or Expo Metro.
What agents actually do with the browser
Real workflows you can build today, with the QA Engineer role and Agent Teams.
End-to-end smoke test on every handoff
Wire a Dev to QA team. The QA agent navigates to your localhost dev server, clicks through the critical paths (signup, checkout, dashboard), screenshots the result, and signs off only if nothing throws. Catch regressions before a human ever opens the page.
Visual regression QA
Before-and-after screenshots on UI changes. The agent loads the page on the previous commit, screenshots, switches branch, screenshots, asks Claude to compare. Cheap visual diff QA without Percy or Chromatic in the loop.
Console error hunting
The agent navigates the app, calls browser_get_logs, finds React hydration warnings, useEffect warnings, network 404s, CORS errors, deprecation notices. Reports them as a list of risks in the team handoff payload, the next Dev agent fixes them.
Form validation testing
The agent fills the form with valid data, with empty fields, with edge cases (XSS strings, very long inputs, non-ASCII). Verifies the validation messages, the network requests, the redirects. Real form QA, not unit tests.
Accessibility audit
The agent walks the page, queries the accessibility tree via browser_get_state and browser_evaluate, checks alt texts, ARIA attributes, focus management, keyboard navigation. Reports issues with screenshots.
Design QA against Figma
Combine with the Figma to AI agents feature. The agent loads the Figma frame, screenshots, loads the localhost page, screenshots, compares spacings, fonts, colors, alignments. Files a list of mismatches.
Live preview tunnel verification
Pair with the AgentsRoom localhost tunnel. The agent navigates to the public HTTPS preview URL (not localhost), verifies the site is reachable from the outside world, screenshots, and confirms a stakeholder can actually open the link.
Reproduce a customer bug from a public backlog ticket
Public backlog ticket comes in with a URL and steps to reproduce. The QA agent opens the URL, follows the steps, captures the console error, attaches the screenshot, hands off to Dev with a clean repro. No more 'cannot reproduce' loops.
Point at an element, send it straight to the agent
Driving the browser is only half the story. Sometimes you are the one who spots the problem: a button that is misaligned, a label with the wrong copy, a card that breaks on mobile. Instead of describing it in words, you point at it. The built-in browser has a point mode: click any element on the page and AgentsRoom captures its exact CSS selector from the live DOM.
Add a short note like 'tighten this spacing' or 'wrong color here', and the pointed element plus your annotation are sent to the active agent as a precise, unambiguous change request. No more 'the third card from the left': the agent gets the selector, the surrounding context and your intent in one shot.
Point mode in the AgentsRoom browser: click an element, add a note, and the exact selector plus your annotation are sent to the agent as a pointed change.
Enter point mode
Open the embedded browser on your app and hit the point button. Every element highlights as you hover over it.
Click the element
Click the button, text block or card you want to change. AgentsRoom locks onto it and reads its exact CSS selector from the live DOM.
Add a note and send
Type what should change and confirm. The selector, the surrounding context and your note are handed to the active agent as a pointed change.
How an agent gets a browser
Open the Browser tab in your room
In your project room, the right panel exposes three tabs: Files, Changes, Browser. Click Browser. The panel widens, the side bar collapses, and a real Chromium view appears. Type a URL or pick from the project history.
Tick 'Browser access' on the agent
Open the Edit Agent modal, expand Capabilities, tick Browser access. AgentsRoom merges the agentsroom-browser entry into your project's .mcp.json and the agent will see the browser tools at next start.
<project>/.mcp.jsonThe agent boots with the browser MCP
On agent spawn, Claude (or Codex, Antigravity, etc.) initializes the agentsroom-browser MCP server, lists its tools (browser_navigate, browser_click, browser_type, browser_screenshot, browser_evaluate, browser_wait_for, browser_get_state, browser_get_logs, browser_go_back, browser_go_forward, browser_reload), and from now on can drive the browser.
The agent uses the browser
The agent navigates, clicks, types, screenshots, reads console. Each action goes through a loopback WebSocket bridge (127.0.0.1, OS-assigned port, 32-byte hex token, regenerated at every boot of the desktop app). After every page-changing action, a screenshot is returned inline so the agent visually verifies its move.
Auto-target localhost or your tunnel
If a localhost tunnel is running, the first navigation lands on the tunnel URL. Otherwise, the first detected dev server. Otherwise, https://localhost:3000. Combined with Dev Terminals, the agent literally starts the dev server, then opens it in the browser, then tests it.
Verify, screenshot, hand off
When wired into Agent Teams, the QA node runs its scenarios, captures screenshots, sets flags.qaPassed in the handoff payload. The next agent inherits the verdict. Pass goes to the PM, fail loops back to Dev with the test hints.
Under the hood
For the curious. The browser automation stack is small on purpose.
Each project has one Chromium WebContentsView (the modern Electron API, not the deprecated BrowserView), overlaid on the main window at bounds streamed from the React renderer. Per-project session partition keeps cookies, localStorage and authentication isolated between projects. Default offscreen bounds let agents call browser tools even before the human opens the Browser tab, with a 5-second timeout on screenshots to avoid hangs.
A lightweight WebSocket server (browser-bridge.ts) runs on a loopback port chosen by the OS, bound to 127.0.0.1 only. Authentication uses a 32-byte hex token regenerated at every desktop boot. The bridge file ~/.agentsroom/browser-bridge.json holds the current port, token and PID, atomically rewritten on each boot, so the MCP subprocess always picks up fresh credentials with automatic retry.
The MCP server itself is browser-mcp-server.cjs, a zero-dependency Node script that implements the MCP 2024-11-05 protocol over stdio (initialize, tools/list, tools/call). It speaks JSON-RPC to the WebSocket bridge through a hand-rolled WebSocket client (no ws, no @modelcontextprotocol/sdk). Tiny, fast, easy to audit. Bundled as an extraResources file in the desktop app, so every install ships with it ready to go.
Native browser support (a first-class browser feature beyond the MCP) is on the AgentsRoom roadmap. Beyond that, the long-term plan includes additional MCPs so agents can also drive non-web targets: a React Native MCP for mobile apps and an Electron MCP for desktop apps. Same idea, same UX: the agent does not just write code, it actually exercises the running app.
FAQ
How is this different from Playwright MCP or Puppeteer-based browser tools?
Playwright and Puppeteer-based MCPs spawn a fresh headless browser on every session. That is fine for stateless tasks, but it loses cookies, localStorage and auth between calls, and the human cannot see what the agent is doing. AgentsRoom Browser is the same browser the human uses inside the app, with persistent per-project session, visible to the user in real time. The agent drives a window you can see and override at any time. It is a more honest, more debuggable browser automation.
Does this work with all AI providers, or only Claude Code?
It works with every provider AgentsRoom supports: Claude Code, Codex CLI, OpenCode, Antigravity CLI, Aider, Grok Build, Mistral Vibe and Kimi Code. Browser tools are exposed through the standard Model Context Protocol, which all these CLIs read from .mcp.json. The agent never knows it is in AgentsRoom, it just sees a set of MCP tools and uses them as it would use any other tool.
Can the agent drive a remote site, or only localhost?
Both. Type any URL and go. Localhost (and host:port forms) are smart-detected, prefixed with http://, and opened directly. Public sites work like in any normal browser, with cookies and login state preserved per project. Combined with the AgentsRoom localhost tunnel, the agent can also drive your local dev server through a public HTTPS URL, which is useful for cross-network and mobile QA.
Is the browser MCP secure? What stops it from being abused?
The bridge binds to 127.0.0.1 only, never to 0.0.0.0. The port is OS-assigned (no fixed port for collision-prone scanning). A 32-byte hex token is required on every connection, regenerated at every desktop boot. The MCP subprocess receives the credentials only via env vars, never in any committed file. Browser access is opt-in per agent in the Edit Agent modal. If you remove it, the .mcp.json entry is removed and the agent cannot use the tools anymore.
Does the agent see the browser console (errors, warnings, network)?
Yes, via browser_get_logs. The buffer holds console.log, console.warn and console.error messages from the page's main world. Many real bugs (React hydration errors, useEffect warnings, CORS failures) only surface in the console, never in unit tests, so this turns out to be one of the highest-signal tools for the QA agent.
What happens to the screenshots returned to the agent? Do they cost a lot of tokens?
After every page-changing action, a base64 PNG screenshot is appended to the tool response, capped at 1.6 MB. Above that, a text marker is sent instead. Screenshots are critical for reliability (an agent that sees the screen makes far fewer mistakes), so the trade-off is worth it. If you want to disable screenshots for budget reasons, plain browser_evaluate calls return text only.
Can the agent fill a login form? Persist its session?
Yes. Cookies and localStorage are persisted per project under the persist:agentsroom-browser-<projectId> session partition. The agent can log in once with browser_type and browser_click, and stay logged in across the rest of the run. When you switch project, the session changes, so credentials never leak across projects.
Will the agent break if the dev server is not running?
It will navigate to the URL and see a Chromium error page. It can read that error via browser_get_state and browser_get_logs and react accordingly: ask you to start the server, or call a Dev Terminals command to start it. With Agent Teams and Dev Terminals, you can wire a workflow that starts the server, waits, then opens the browser, all without human intervention.
Are mobile apps and desktop apps supported too?
Web is shipping today, through the embedded Chromium and the AgentsRoom Browser MCP. The roadmap includes a native AgentsRoom Browser as a first-class browser feature. Beyond that, additional MCP servers are planned: a React Native MCP so agents can drive iOS and Android Expo bundles, and an Electron MCP so agents can drive desktop apps that are not web. The same agent logic, applied to non-web targets.
Can the human pause the agent and take over the browser?
Yes. The browser is the same Chromium view the human uses. At any moment, click in the Browser panel and you are in control. Once you stop interacting, the agent can resume its tool calls. There is no concept of 'agent-locked browser', it is a shared surface, exactly like a pair-programming session.
About : Agent Delegation
Let a cheaper QA agent run the browser, not your dev agent
The Browser MCP shines brightest when the dev agent does not drive it directly. Agent delegation routes the browser test to a separate, cheaper QA agent through a single run_qa_test MCP call. Your Opus or Codex stays focused on shipping code, the QA agent does the clicks on a smaller model, the verdict comes back as one line. Same Browser MCP, lighter bill, cleaner context.
Read the Agent Delegation pageGive your agents real browser eyes
Tick Browser access on any agent in AgentsRoom. The Browser MCP boots automatically. Your QA agent finally tests what it ships.
Companion app: monitor your agents on the go
Bring your own: Claude, Codex, Antigravity CLI, or other AI provider.
Push bugs and requests straight to your public backlog.
A glimpse of AgentsRoom in action.